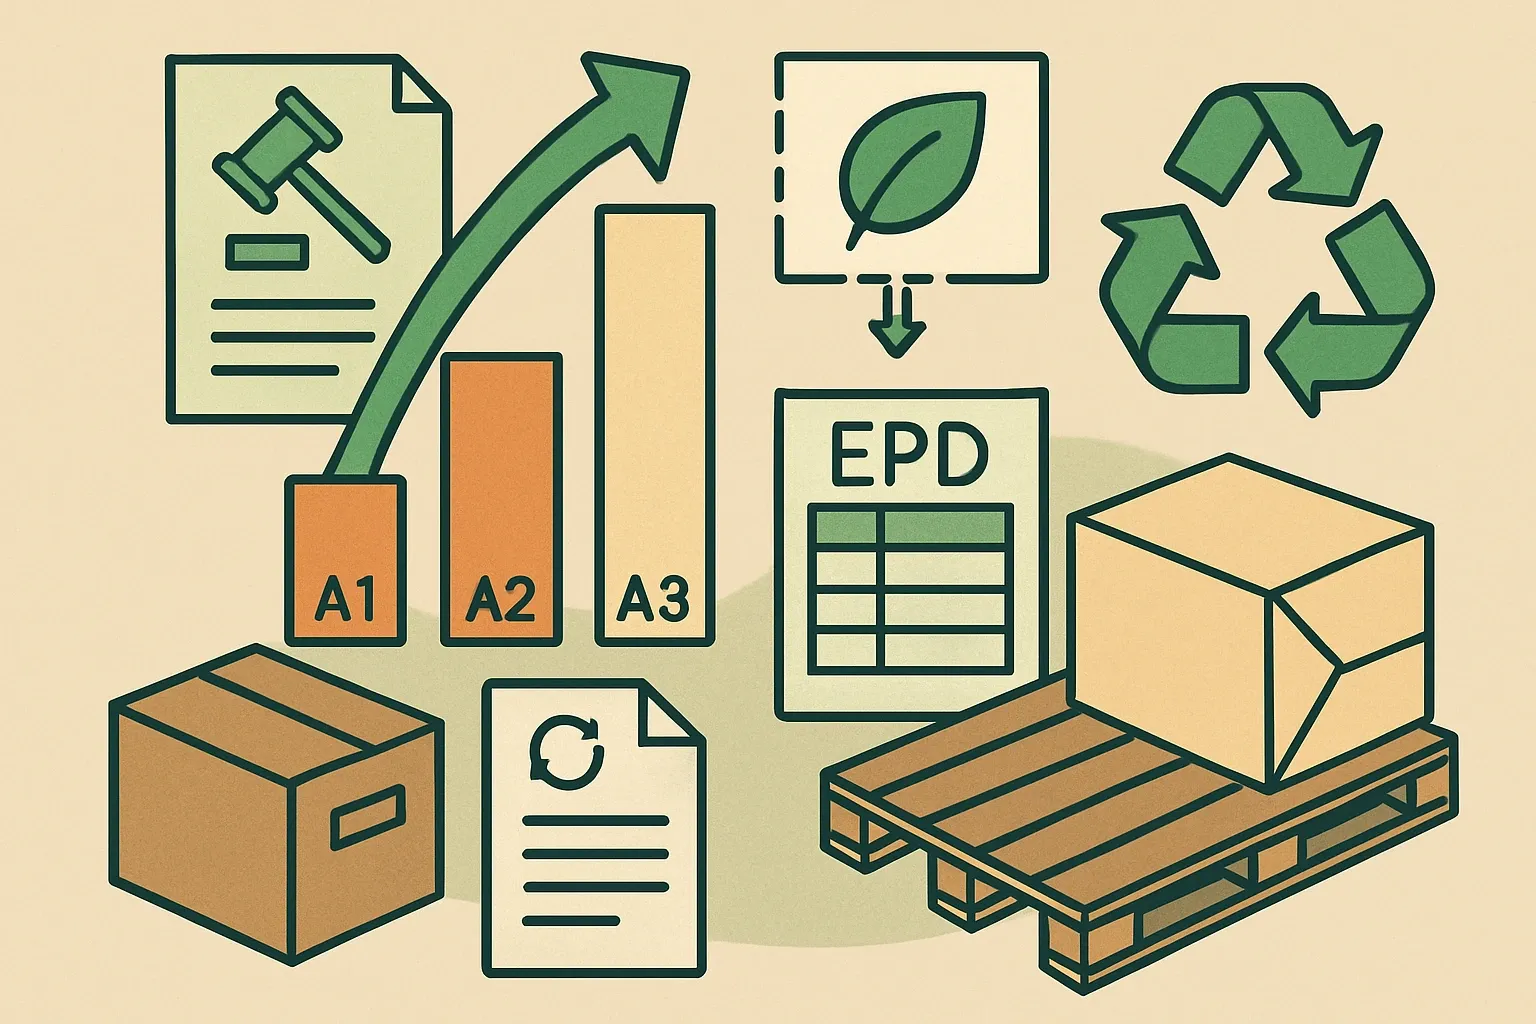
Why packaging trips up GWP‑biogenic
EN 15804+A2 splits climate change into fossil, biogenic, and land use categories. Packaging that is paper, cardboard, or wood brings biogenic carbon into scope. Some of that carbon remains stored with the product for a while, some exits as production waste, and some is released later at end of life. If those paths are not separated, GWP‑biogenic can show a negative total in A1 to A3 that surprises readers. It make results look upside down.
Where the biogenic carbon actually sits
Think in two locations. First, raw material packaging that never ships, like supplier sacks and pallet sheets used on the line. Second, finished‑product packaging that leaves your gate, like cartons and pallets sent to the jobsite. The first belongs entirely in A1 to A3. The second straddles A1 to A3, A4, and A5, then shows up again in C and possibly D if there is energy recovery or recycling.
A fast modeling pattern for A1 to A3
Start with total biogenic input mass for the reference flow period. Convert to biogenic CO2 by multiplying carbon mass by 44 divided by 12, the molecular weight ratio of CO2 to C (US EPA, 2024) (US EPA, 2024). Use the simplest credible carbon content for wood‑based fibers when supplier data are absent, commonly 50 percent carbon by dry mass, and disclose that default (FAO, 2005) (FAO, 2005).
Then split that biogenic CO2 into two rows inside A1 to A3: one for material that exits the line as waste, one that remains attached to outbound products. Record process emissions from on‑site combustion or drying separately as biogenic releases in A3 if relevant.
What to do with finished‑product packaging in A5
Finished‑product packaging that is removed at installation belongs in A5, not A1 to A3. Model realistic jobsite waste management routes, then carry the same biogenic carbon to C or D according to the end‑of‑life scenario. Where markets collect and recycle paper and cardboard at high rates, note it briefly so buyers understand why C and D values are moderate rather than extreme. In the EU, paper and cardboard made up about 40 percent of all packaging waste in 2023, a reminder that biogenic packaging is a large share of the waste stream that sees high collection activity (Eurostat, 2025) (Eurostat, 2025).
Want to clarify your GWP-biogenic packaging strategy?
Follow us on LinkedIn for insights that simplify compliance and help you win more specs.
Handling negative numbers without confusion
Negative values in GWP‑biogenic represent temporary storage, not magic. Keep them, but make the movement obvious. If packaging stays with the product, show the removal in A1 to A3 and the release later in C. If packaging is scrapped during manufacturing, the removal and release both occur inside A1 to A3. Avoid netting across modules in the narrative. Instead, explain the timing so readers connect the minus sign to where the carbon goes next.
A pocket example to copy
Imagine one product unit ships with 0.30 kg of corrugated cardboard. Assume 50 percent carbon by dry mass. Carbon in the packaging is 0.15 kg C. Convert to CO2 using 44 over 12. Stored biogenic CO2 equals 0.55 kg. In the model, place −0.55 kg CO2 biogenic in A1 to A3 as storage if that carton leaves your gate, then model its release under C flows according to the declared end‑of‑life path. If 70 percent of cartons are recycled and 30 percent landfilled in the target market, reflect the split in C and D, and say plainly that rates vary by project if you lack tighter geography.
Data to capture once, reuse across SKUs
Capture a supplier‑specific bill of packaging for each major input and for outbound shipments. Record per‑unit masses, moisture, recycled content, and whether packaging remains with the product. Ask suppliers to confirm whether transport packaging is one‑way or returnable. When data are missing, document the fallback and state that wood‑derived packaging defaults to 50 percent carbon by dry mass until supplier numbers arrive (FAO, 2005).
The one table buyers love
Add a small note under your EN 15804 tables that translates the biogenic math to everyday words. One line that says, for example, "Outbound carton stores 0.55 kg CO2 biogenic in A1 to A3, then releases in C per modeled end‑of‑life" aligns procurement and sustainability teams. It turns a head‑scratch into a nod.
Verifier proof points to write down
- What portion of supplier packaging is included in A1 to A3 and how it is measured per functional unit.
- Which finished‑product packaging components ship to customers and where they are modeled later.
- Carbon content assumptions and the 44 over 12 conversion factor reference (US EPA, 2024).
- Market recycling or recovery rates used for sensitivity, with the year and geography, for example EU packaging composition where paper and cardboard are about 40 percent by mass in 2023 (Eurostat, 2025).
- How negative signs are carried from A1 to A3 to C without netting in the narrative.
Why this pays off in specs
Clear biogenic packaging logic removes back‑and‑forth during verification, shortens lead time to publication, and gives sales a cleaner story. Buyers see the timing of removals and releases, not mystery math. That makes your EPD easier to compare, which is exactly what busy specifiers want when they skim packging notes during bid season.