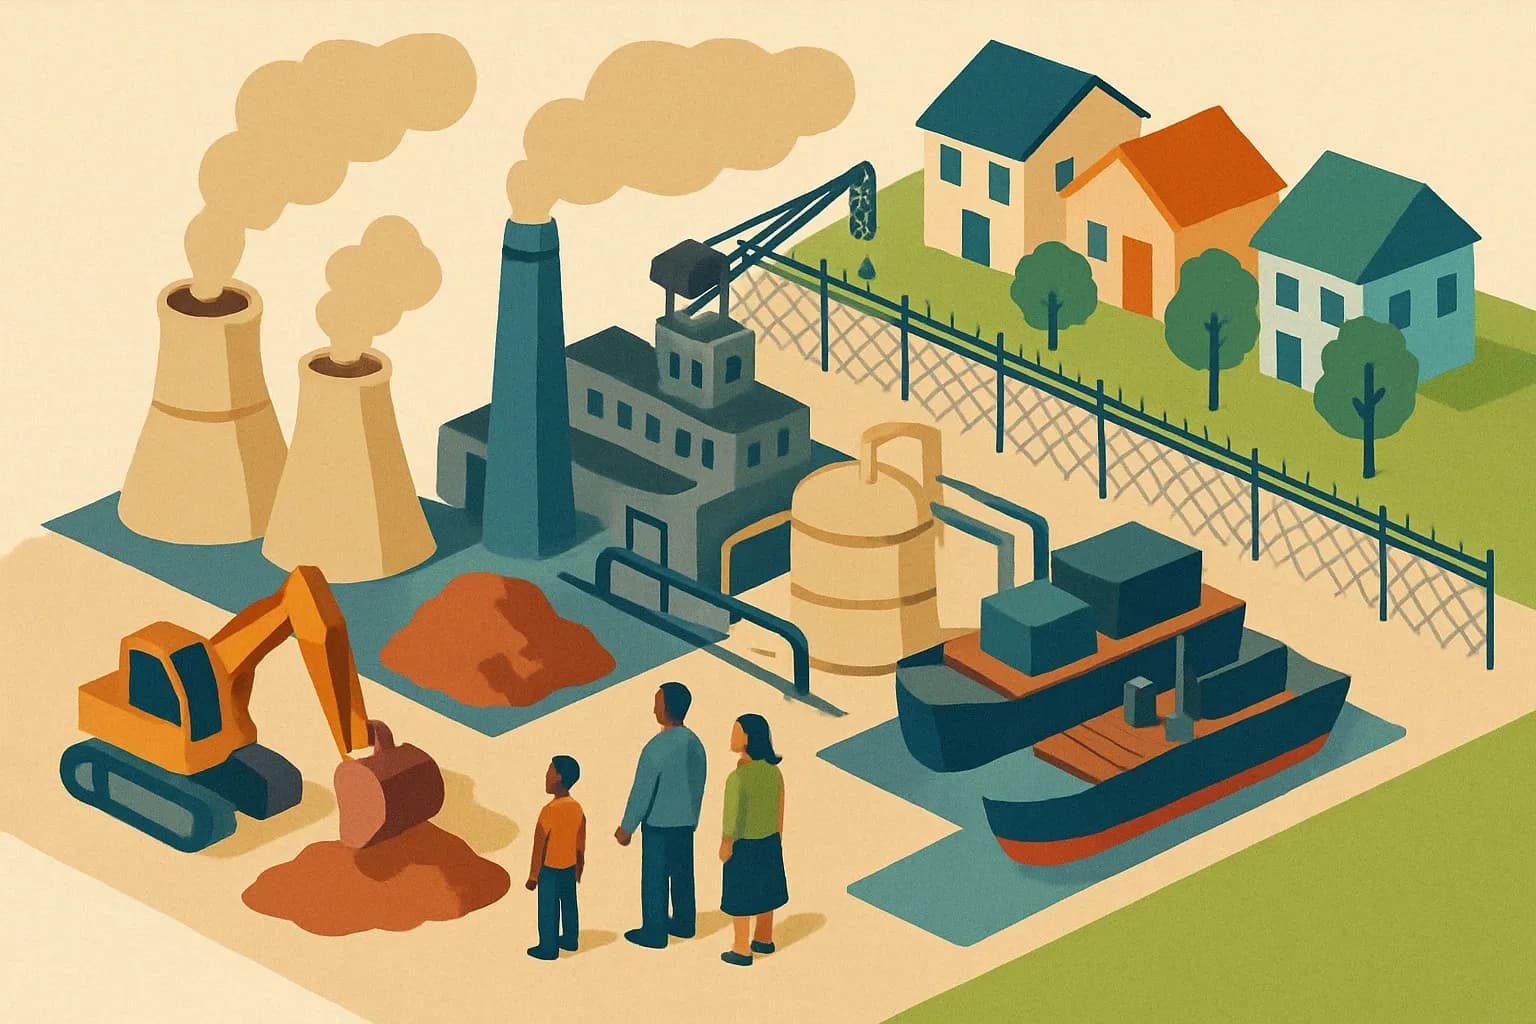
What “fenceline” really means for materials
Fenceline communities are the neigborhoods next to the places where materials are extracted and made. Think homes downwind of a kiln, schools near a resin line, or a fishing town beside a discharge point. One recent study estimates that about 47 million people in the contiguous United States live within one mile of fossil fuel infrastructure, roughly 14 percent of residents, with a higher share of non‑White and urban populations affected (Boston University SPH, 2025) (BU SPH, 2025).
Toxicity and disproportionate exposure are not abstract
EPA’s AirToxScreen shows national screening‑level cancer risk from air toxics around 26 in a million. In communities within 1 to 10 miles of certain facility types studied, that average increases to roughly 28 to 29 in a million. Screening respiratory risk is also higher near these facilities compared with the national average of 0.31 hazard quotient, rising to about 0.34 to 0.35 (EPA RIA Addendum, 2024) (EPA, 2024). These are small ratios on paper that translate to real asthma, lost school days, and medical bills.
Pollution often sits outside the price tag
In 2023, 21,669 facilities reported to the Toxics Release Inventory. They reported 3.3 billion pounds of releases to air, water, and land, while 90 percent of TRI chemical waste was managed by recycling, treatment, or energy recovery instead of release (EPA TRI National Analysis, 2026) (EPA TRI, 2026). Even with prevention improving, the remainder still lands in air sheds, watersheds, and soils where nearby families live and work. Those externalities rarely appear on a product invoice.
Better materials is bigger than indoor air and carbon
Low‑VOC and lower GWP are table stakes. The harder question is whether a resin change, dye package, or alloy tweak reduces toxic outputs at the plant and upstream. That is where environmental justice shows up in materials work. It is also where your product strategy either builds community goodwill or spends it.
The AIA lens is explicit about this
The AIA Framework for Design Excellence connects materials decisions to equitable communities, water, ecosystems, resources, and well‑being. The guidance asks project teams to evaluate manufacturing impacts on workers and surrounding communities, not just occupants. This is not a niche concern in specifier thinking. It is increasingly standard language in RFPs, alternates, and submittal reviews.
Join Parq Pulse!
Our weekly newsletter for manufacturers mobilizing product and environmental insights to remain competitive and win more projects.
What architects and owners now ask for
Design teams are pressing for evidence that a product’s impacts are not simply moved offsite to someone else’s backyard. They want signs of continuous improvement and local stewardship. They also want documents they can point to when reviewers ask where the harm went.
Evidence manufacturers can surface without theatrics
- Process changes that cut hazardous outputs at the source. Show measured reductions for specific pollutants, not just a policy. Tie them to source reduction activities where possible.
- Sourcing controls for additives, fillers, and binders. Document restricted substances lists, supplier conformance, and incoming QC that prevents regrettable substitutions.
- Local air and water stewardship. Publish recent stack test summaries, stormwater sampling trends, and spill‑prevention audits in plain language. Where data are confidential, provide ranges and methods.
- Surrounding‑community impact documentation. Share monitoring partnerships with local schools or clinics, complaint response logs, and investments in filtration, enclosures, or capture systems.
- TRI and permit context. Note current status, recent inspections, and corrective actions closed. If a violation occurred, include what changed next.
Where EPDs and HPDs help, and where they do not
EPDs are built on LCAs and communicate quantified impacts across life‑cycle stages like raw material supply, transport, and manufacturing. They are excellent for carbon, energy, and several ecosystem indicators. HPDs complement that by disclosing ingredients and hazards to support material health decisions. Neither format is a substitute for fence‑line monitoring or TRI and permit data. The smart play is to publish strong EPDs and HPDs, then link them to a short, public brief that explains plant‑level protections and nearby community outcomes.
Make it commercially concrete
Teams chasing LEED v5 credits and AIA‑aligned outcomes do not want to justify a product that looks clean in the spec but dirty at the gate. The manufacturers who win are the ones who can answer three simple questions in writing. What changed in the process. What changed in the supply chain. What changed for the neighbors.
A practical next step this quarter
Pick one high‑volume line. Map the top three toxic outputs, the top three inputs linked to them, and the current controls. Record any 2023 or 2024 source‑reduction actions and their measured effect. Pair that with a one‑page summary of recent air and water data and a contact path for community concerns. You can ship that packet with your EPD and HPD in submittals. It reads as care and proof.
The thread to hold
It is tempting to treat environmental justice as an add‑on. Resist that. Materials choices write a story that nearby families will live with for years. Show how your product cuts carbon and indoor emissions, yes. Then show how it reduces harm for the people beyond the fence. That is what credibility looks like when specs meet streets.