Why freight data makes A2 and A4 credible
A2 and A4 often swing results for bulky or heavy goods because transport scales with mass and distance. Treating them as placeholders invites reviewer pushback and missed bids. We favor simple, auditable inputs that mirror how freight actually moves.
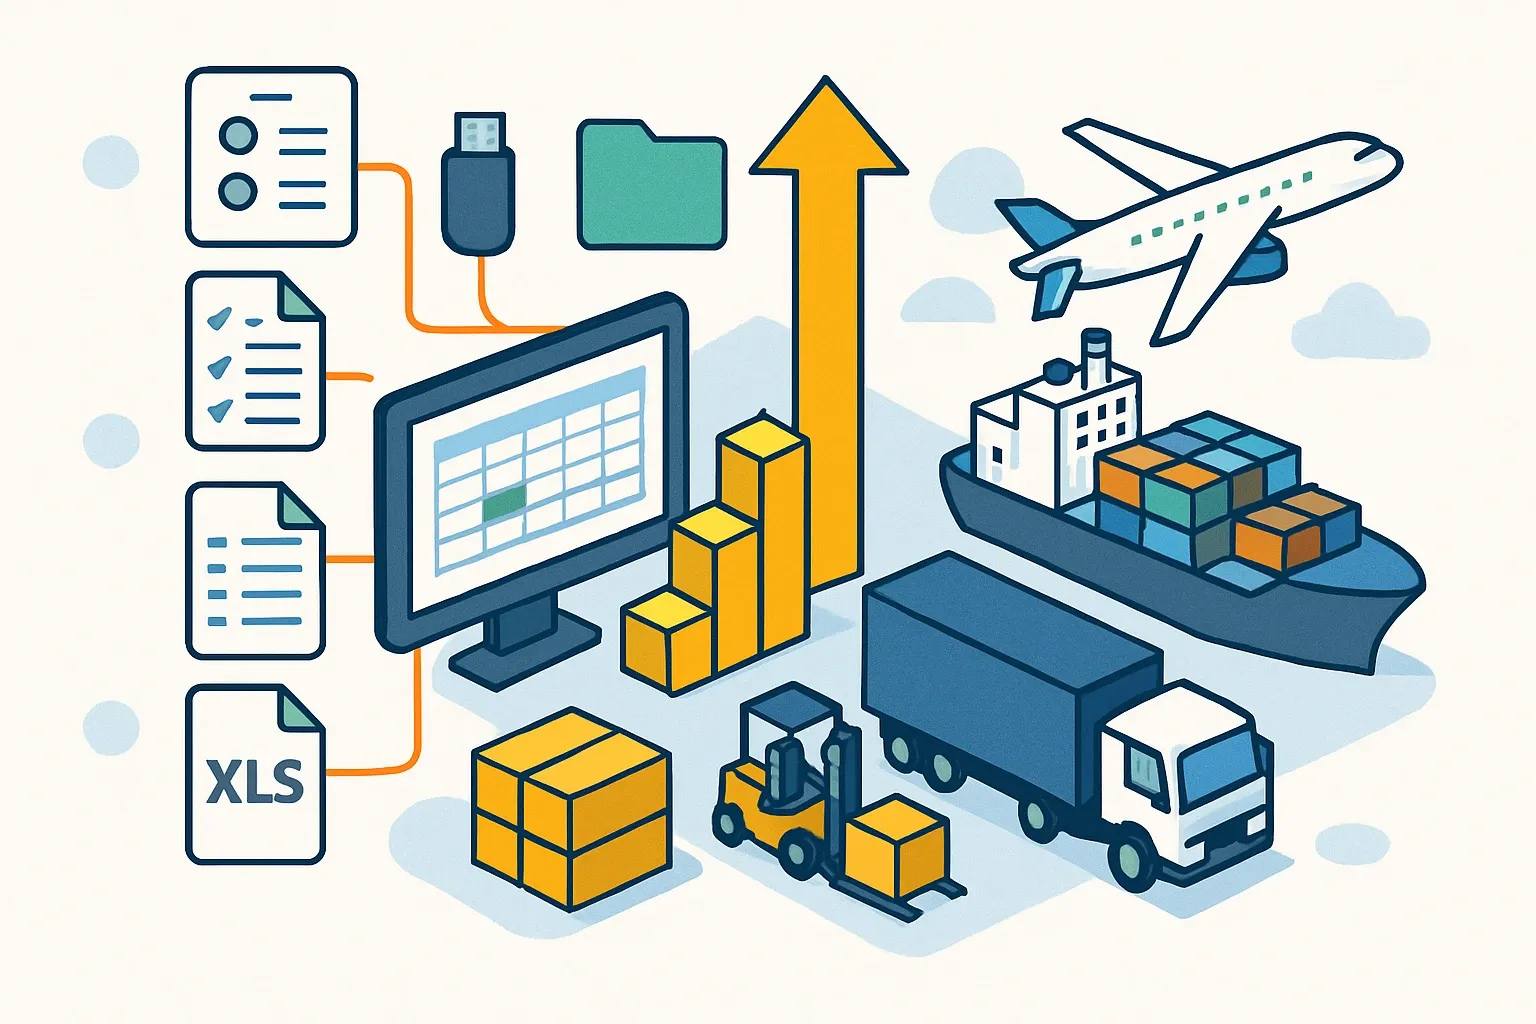
The one export that solves 80 percent of effort
Ask for a consolidated shipment dump for a clear date range that matches the EPD reference year. Include these minimum fields:
- Shipment date range
- Origin and destination location codes or cities
- Weight shipped and weight unit
- Mode and submode where available
- Unique shipment ID or invoice reference
If systems are seperated by mode, pull each and combine once in a spreadsheet. Keep the raw tabs intact so the audit trail is obvious.
Want to enhance your EPD accuracy with better freight data?
Follow us on LinkedIn for insights that help you win tenders and optimize your supply chain.
Align shipments to production volumes
EPDs are volume weighted. Tie each plant and product family to the shipment records so you can scale a lane share by tonnes shipped in the reference year. If the ERP lags shipping by a couple weeks, document the lead or lag and use the cleanest year match. Reviewers look for method clarity more than perfect synchronicity.
Build mass-weighted lane averages fast
Group records by lane and mode, sum weight and distance, then compute grams CO2e per lane using a consistent factor set. Average by mass so heavy lanes speak louder than small, sporadic ones. This avoids cherry picking and makes updates painless when next year’s data arrives.
Pick emission factors that reviewers recognize
Use a single, reputable factor source across all modes to keep apples with apples. Air freight can be roughly 40 to 60 times more carbon intensive per tonne‑kilometre than container ocean, which is why mode choice dominates many A4 results ( DEFRA, 2024 ). If exact lane factors are missing, say so and apply conservative, published averages.
Handle dates, gaps, and oddballs
Seasonality and project spikes happen. When the reference year includes a one‑off mega shipment, flag it and test a sensitivity case in your workpaper. For missing mode tags, infer from carrier names or service levels and mark assumptions plainly. The goal is defensibility, not clairvoyance.
Translate the dataset into A2
Inbound A2 covers raw materials, components, and packaging headed to your plants. Map supplier origins to plant destinations. Where suppliers consolidate at a DC before your site, treat the DC as an intermediate leg and keep both legs visible in your calc sheet. Reviewers appreciate transparent leg logic.
Translate the dataset into A4
Outbound A4 moves finished goods from your plant or DC to the first customer gate. Use actual ship‑to destinations where possible. If the sales footprint is broad, define representative lanes that together cover at least 80 percent of shipped mass and document the cut line. This keeps the model lean without losing signal.
Tie modeling choices to commercial value
Better A2 and A4 inputs do more than pass verification. They reveal lane hotspots and practical changes, like consolidating partial truckloads or shifting certain corridors to rail or sea where feasible. That can protect margin in bids and strengthen low‑carbon claims buyers now expect, especially on projects chasing LEED v5 points.
Keep the loop spinning
Once structured, the freight dataset becomes a living asset. Refresh the export each year, re‑run the mass‑weighted averages, and track any mode shift or supplier relocation. When the next EPD refresh comes due, you will not be starting from zero. You will be reporting progress with receipts.


