13,512 Declarations So Far and Counting
Publishers averaged nearly fifty new documents every day through September. Momentum feels less like a niche compliance exercise and more like a market developing.
Q1 Surge: February Hits 2,334 Filings
February alone delivered seventeen percent of the year-to-date total. Many teams aim to unveil EPDs before spring bid seasons open, so the front-loaded curve makes commercial sense.
Summer Slowdown, September Rebound
July dipped to 889 files and August to 809 as European vacation calendars and US plant refits throttled data collection. Activity snapped back in September with 1,289 releases, hinting at a strong Q4 pipeline.
Asphalt Pulls Ahead at 38.4 Percent Share
Asphalt owns 5,185 declarations, more than concrete and the entire "Other" bucket during several months. Highway and airport resurfacing specifications commonly cite an EPD as a pass-fail gate, so contractors now view the document the way airlines view boarding passes, non-negotiable.
Why Infrastructure Dollars Steered the Mix
State and municipal budgets kept flowing even as some federal Buy Clean levers paused. Those local funds earmark resilient pavements and recycled asphalt content, and spec writers lean on EPDs to prove the carbon math. Adoption rose despite the policy headwinds.
Cement and Concrete: 3,826 Files, Two Giants
The category might look fragmented until you see the operator split. NRMCA hosts 1,946 concrete EPDs and ASTM International 1,602. Together they certify ninety-five percent of the segment (NRMCA, 2025).
HVAC Chillers Lead Non-Traditional Entries
Chillers clocked 859 EPDs, eclipsing many entire material families. European energy regulations treat life-cycle impacts as a design parameter, so OEMs certify before auditors arrive. The race to furnish buildings with low-carbon cooling systems is tangible in the data.
Program Operator Scoreboard
Thirty-five registries processed paperwork this year, yet five of them own more than seventy-five percent of the inventory.
Curious about the evolving EPD landscape?
Follow us on LinkedIn for insights that help you identify new opportunities and win more tenders.
How Many Hands on the Wheel?
We count thirty-five distinct program operators that published at least one EPD in 2025. The same figure underpins the scoreboard above, confirming a tight-knit certifier pool governs an ever-expanding declaration universe.
NAPA: A Case Study in Consolidation
National Asphalt Pavement Association issued 5,179 asphalt EPDs, essentially the whole pie. Its single-template workflow resembles an assembly line.
NRMCA and ASTM: Concrete’s Twin Pillars
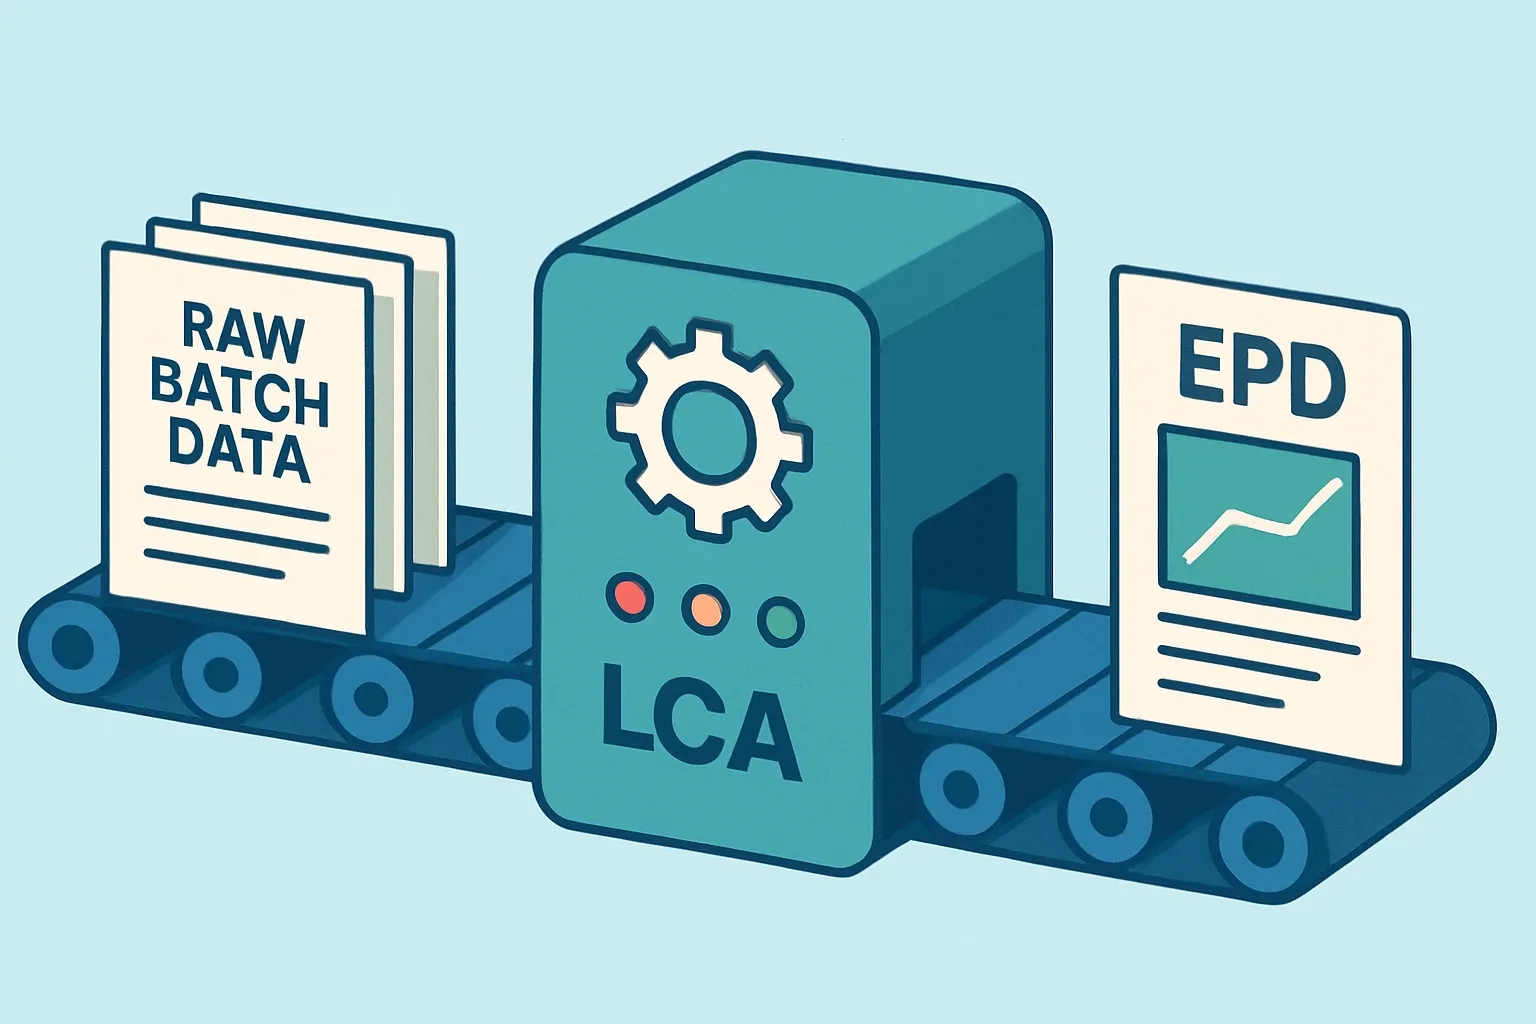
Ready-mix plants gravitate to NRMCA’s digital form because it mirrors batch-ticket data already captured on plant software. ASTM caters to precasters and specialty blends. The two lanes rarely overlap.
Fragmentation in the "Other" Lane
- Association P.E.P: 1,918 files (50.3%)
- SCS Global Services: 320 (8.4%)
- IBU: 292 (7.7%)
- Smart EPD LLC: 232 (6.1%)
- INIES: 214 (5.6%)
- UL: 156 (4.1%)
- Kiwa: 155 (4.1%)
These seven operators command roughly eighty-six percent of "Other" declarations. Twenty-three smaller registries split the remaining fourteen percent, so thirty players jostle in the most competitive and internationally diverse corner of the program-operator landscape.
Manufacturing Hotspots by State and Country
The United States logged 4,880 EPDs across 231 firms. Germany, France, and Italy punch above weight when adjusted for population, indicating strong policy pull. Italy’s 641 EPDs reveal how mid-sized plants responded to product passport talk long before Brussels issued final text.
Pennsylvania’s Asphalt Alley
Lindy Paving’s 698 filings make New Galilee the most transparent asphalt village on the planet. Regional DOT incentives and an efficient data-capture routine turned a rural zip code into an EPD factory.
Texas and California Concrete Corridors
Centex Materials and CalPortland combined for 783 concrete declarations, proving warm-weather markets excel at carbon reporting.
European Innovation Zones
Daikin Applied Europe’s 273 HVAC EPDs illustrate how product-as-a-service models demand life-cycle datasets. Leasing agreements hinge on energy and carbon guarantees, so declarations act as small-print for financiers (Association P.E.P, 2025).
Top Individual Producers to Watch
Apart from the headline leaders, watch Addison Construction Supply in Brazil and carpet makers in the UK who quietly filed dozens of documents. Their moves flag fast-maturing regional markets.
What 684 Manufacturers Tell Us About Maturity
Roughly one in six active firms filed more than ten EPDs this year. That pattern signals a pivot from pilot projects to full portfolio coverage. There is many variables to track but repetition breeds speed.
Regulations Quietly Reset the Playing Field
Even after partial rollback of federal Buy Clean rules, states like New York and Colorado pushed ahead with embodied carbon benchmarks. Manufacturers positioned with valid 2025 declarations enter bids that laggards cannot touch.