Why impact categories exist
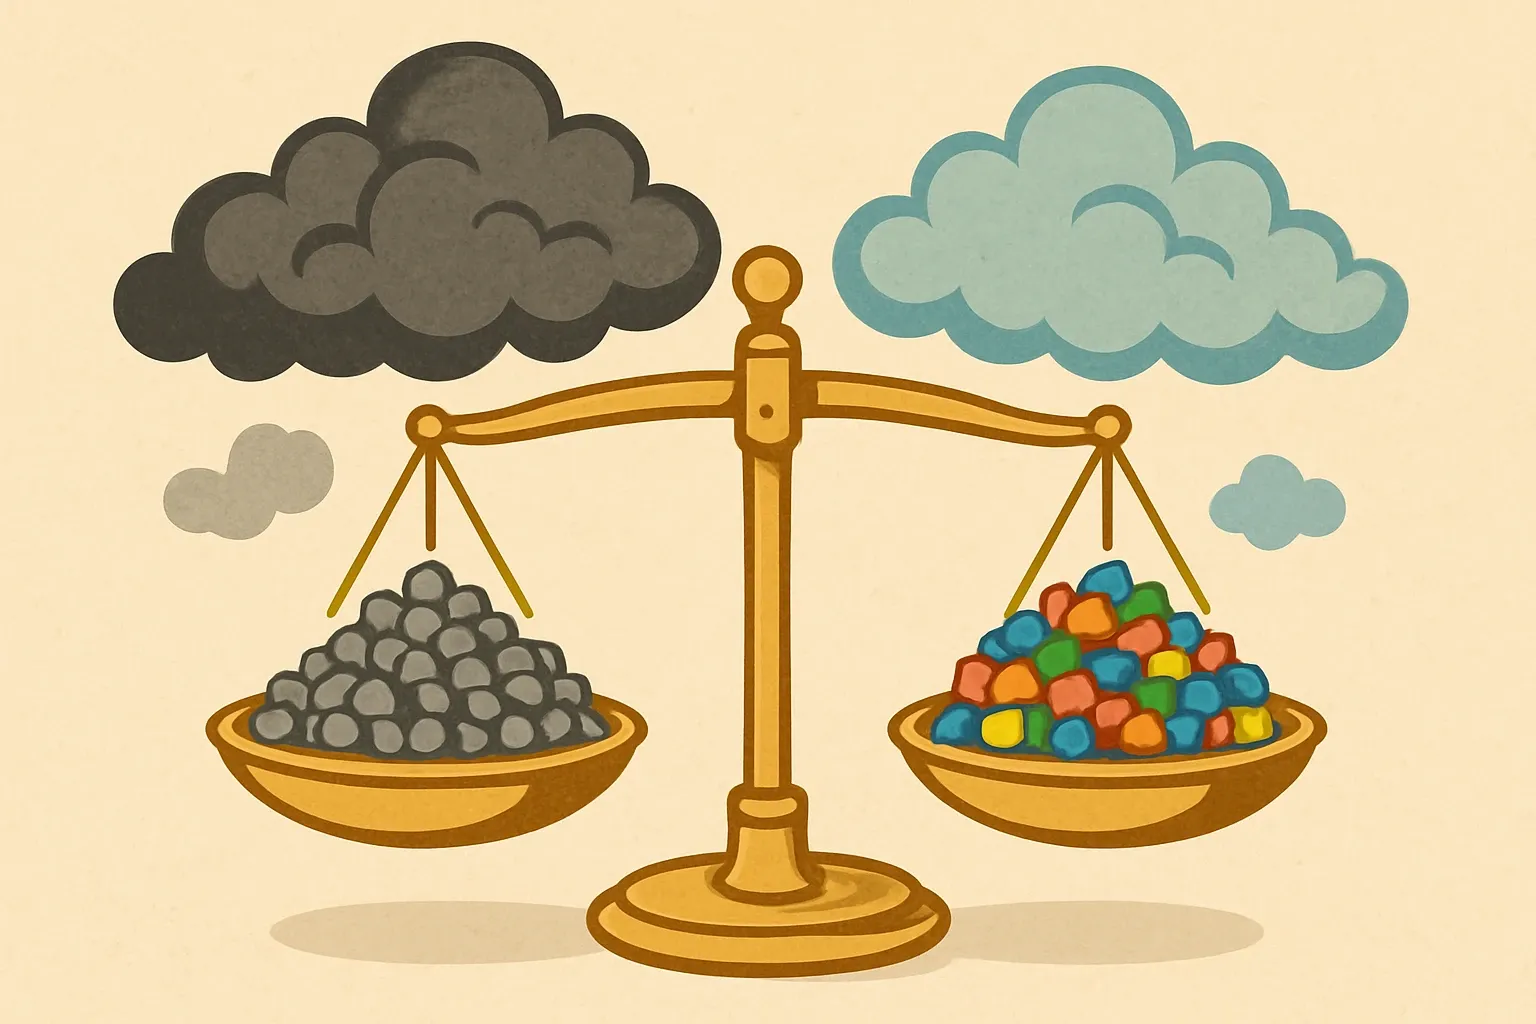
Buildings are a large slice of the climate pie, so clarity beats poetry. In 2022, buildings used about 32% of global energy and caused roughly 34% of CO2 emissions, a level that persisted into 2025 even as efficiency improved (UNEP/GlobalABC, 2025) (UNEP/GlobalABC, 2025). Impact categories translate your product’s life cycle into comparable metrics so project teams can total up footprints and make tradeoffs without guessing.
The rulebooks behind the numbers
Most construction EPDs follow EN 15804 with the +A2 amendment, which defines the indicators and how to calculate them. +A2 requires thirteen core environmental impact indicators, and it separates carbon results into four lines so carbon sources are transparent rather than lumped into one figure (CEN EN 15804+A2, 2019). Program operators align their guidance to this structure, and several also adopt it in newer instructions for PCRs and indicator lists (EPD International, 2024) (EPD International, 2024). If you came looking for “epd impact categories explained,” this is the core set you will meet.
The thirteen you will see most
Think of the table like a nutrition label. Quick definitions that help non‑LCA teammates spot levers:
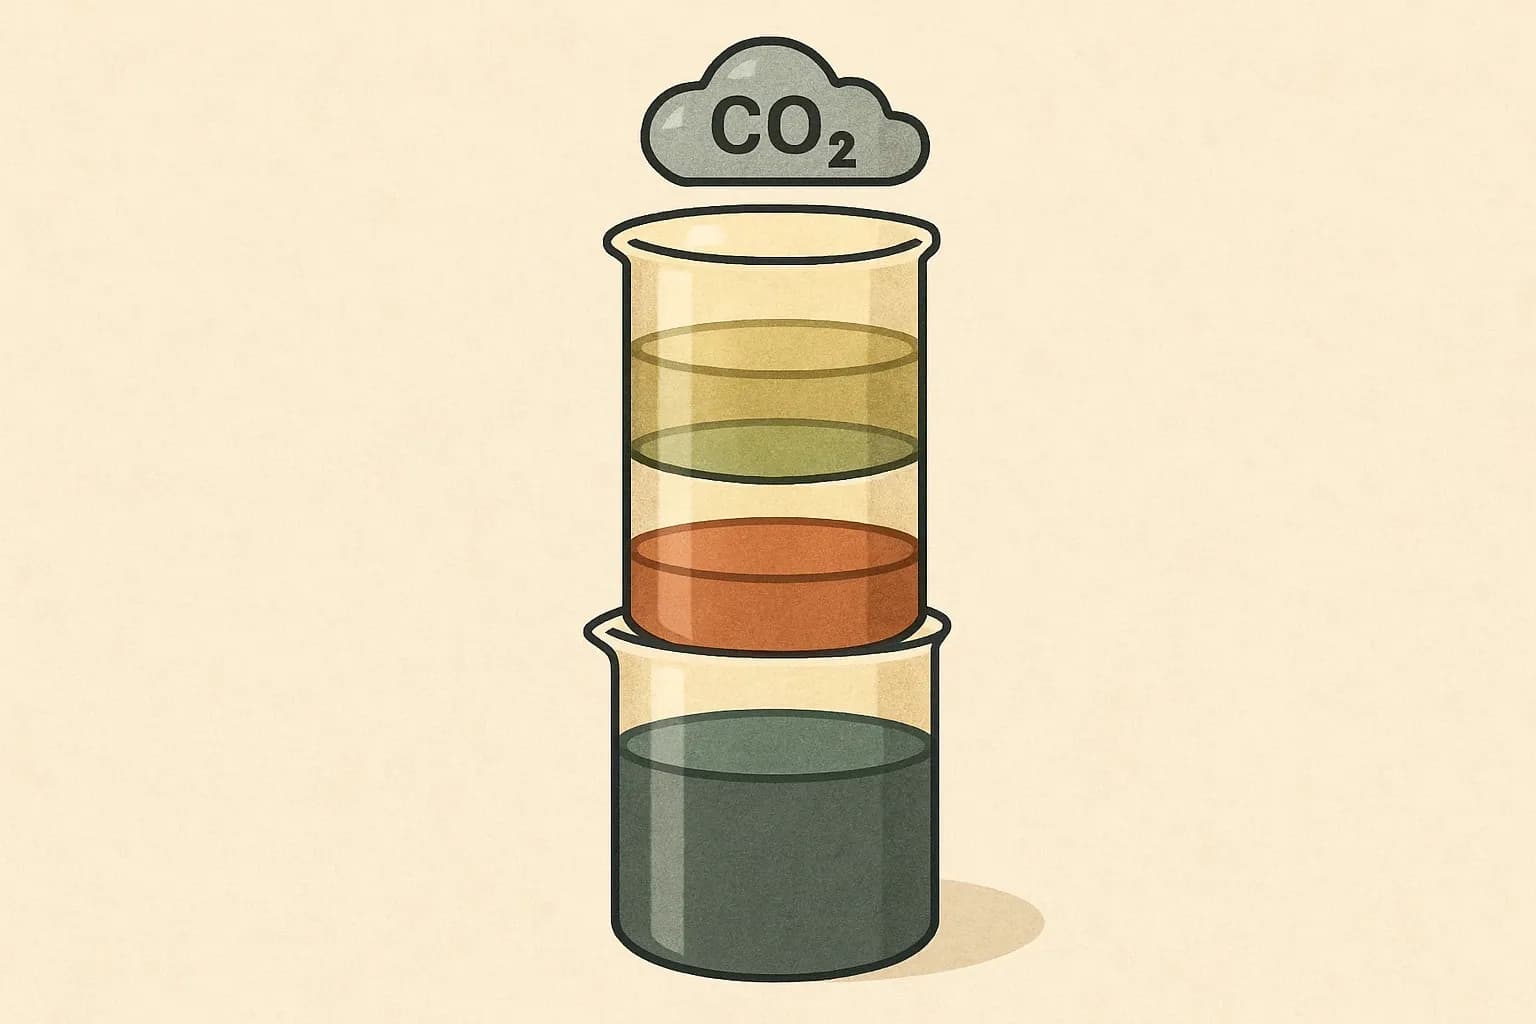
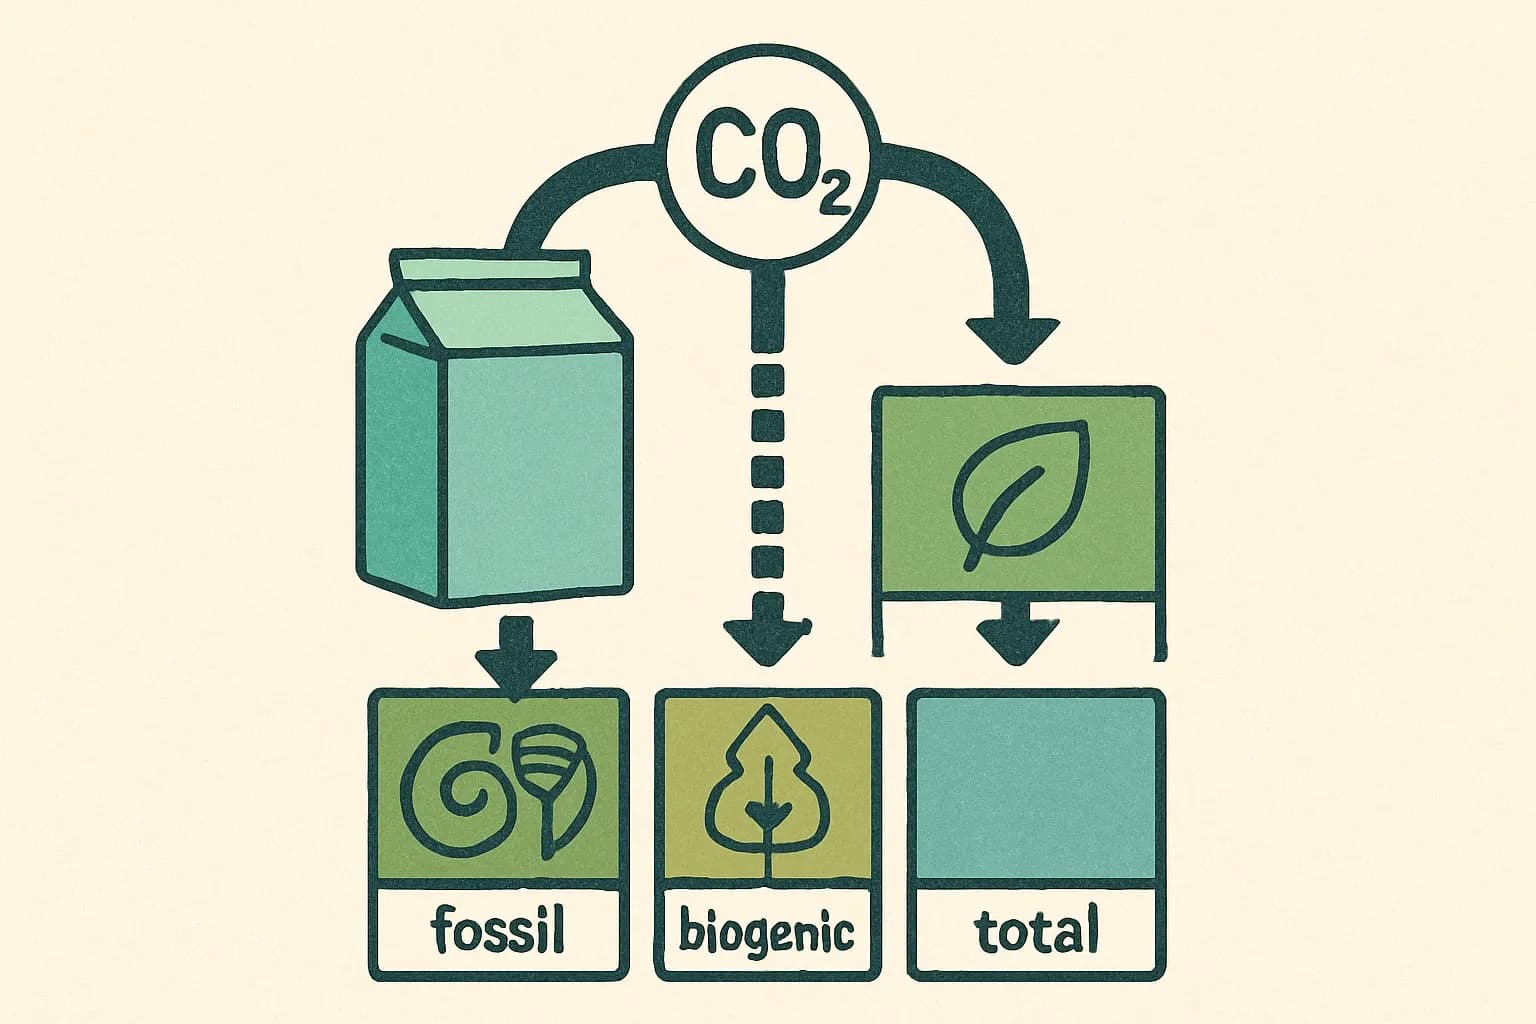
- Climate change, reported four ways. GWP‑total sums the three below. GWP‑fossil covers fossil CO2 and other greenhouse gases. GWP‑biogenic covers biogenic CO2. GWP‑luluc captures land‑use change effects. Action lever: energy mix, clinker or resin content, and process fuel switching.
- Ozone depletion potential (ODP). Influenced by certain refrigerants and feedstocks. Action lever: refrigerant choice and leak prevention.
- Acidification potential (AP). Linked to SOx and NOx that acidify soils and water. Action lever: fuel sulfur, kiln controls, and logistics.
- Eutrophication, split three ways. Freshwater P‑driven, marine N‑driven, terrestrial N‑driven. Action lever: wastewater, fertilizer and upstream process emissions.
- Photochemical ozone formation (often called smog). Driven by VOC and NOx. Action lever: solvents, coatings, curing chemistry, and combustion tuning.
- Abiotic depletion, minerals and metals. Signals pressure on scarce elements. Action lever: alloy recipe, recycled content, and yield losses.
- Abiotic depletion, fossil. A readout on non‑renewable energy carriers. Action lever: electrification and recycled feedstocks.
- Water scarcity indicator. Not liters used but scarcity‑weighted m³ world‑eq. Action lever: site water sourcing and closed‑loop process water.
Some PCRs or project reports add further indicators like ionizing radiation or particulate matter disease incidence. Treat these as early warnings rather than afterthoughts.
Is your EPD making the impact it should?
Follow us on LinkedIn for straightforward insights that help you meet carbon targets and win tenders.
Read carbon splits without falling into traps
Two pitfalls show up in nearly every review. First, teams compare GWP‑total from one EPD to GWP‑fossil from another. Always compare the same row. Second, carbon storage in biobased products can look flattering in A1–A3 yet rebound at end of life. Check modules C and D to see the full story, then decide if design or recycling routes will actually deliver the credited benefits.
Water numbers that confuse smart people
Water in A2 EPDs is scarcity‑weighted. A cubic meter in a stressed basin counts more than one in a wet region. It is normal for total water withdrawal on a utility bill to look large while the WDP line in the EPD looks modest, or vice versa. Focus on where your facilities sit on the water‑stress map before chasing absolute usage.
Align the math to your market
If your customers work to EN 15804, use the A2 indicator set. If a North American PCR still asks for a different method for a specific category, publish both sets within the rules so buyers can compare apples to apples. Program operators publish which indicators are mandatory for their PCRs and keep their lists synced with A2 so you are not guessing (EPD International, 2024) (EPD International, 2024).
Validity and timing still matter commercially
Most program operators set a five‑year validity window for an EPD. That clock typically starts at publication and the EPD can require interim updates if a reported indicator worsens by more than about ten percent (EPD International, 2024) (EPD International, 2024). A current EPD removes penalty assumptions in many specs. An expiring one risks last‑minute rework just when a bid needs clean documentation. Dont leave renewal to quarter‑end.
Where each category points you operationally
Carbon fossil high. Hunt fuel switches, heat recovery, clinker or binder substitution, and grid contracts. Carbon biogenic volatile. Check wood moisture, resin systems, and modeled end‑of‑life. Eutrophication high. Inspect wastewater, upstream agriculture, and scrubbers. Smog high. Look at solvents and burners. ADP minerals high. Switch to higher recycled content and improve yield. Water scarcity high. Prioritize closed‑loop cooling and alternative sourcing at stressed sites.
Compare EPDs like a pro in five minutes
Start with the declared unit and make sure it matches. Confirm scope coverage. Many readers only skim A1–A3, yet A4 transport or C modules can swing totals for heavy products. Line up indicator methods and versions so you are comparing the same math set. Finally, skim the reference year and data quality notes to see if your production today will likely test better or worse.
A simple plan to move fast
Pick your indicator targets first, not last. Then assemble the data once across sites and suppliers so a single LCA model can populate every required line for A2 and any local extras. We prefer ruthless data collection and calm verification over heroics near a deadline. That is how EPDs land quickly, read cleanly, and keep your product in more bids for the full five‑year window (EPD International, 2024) (EPD International, 2024).