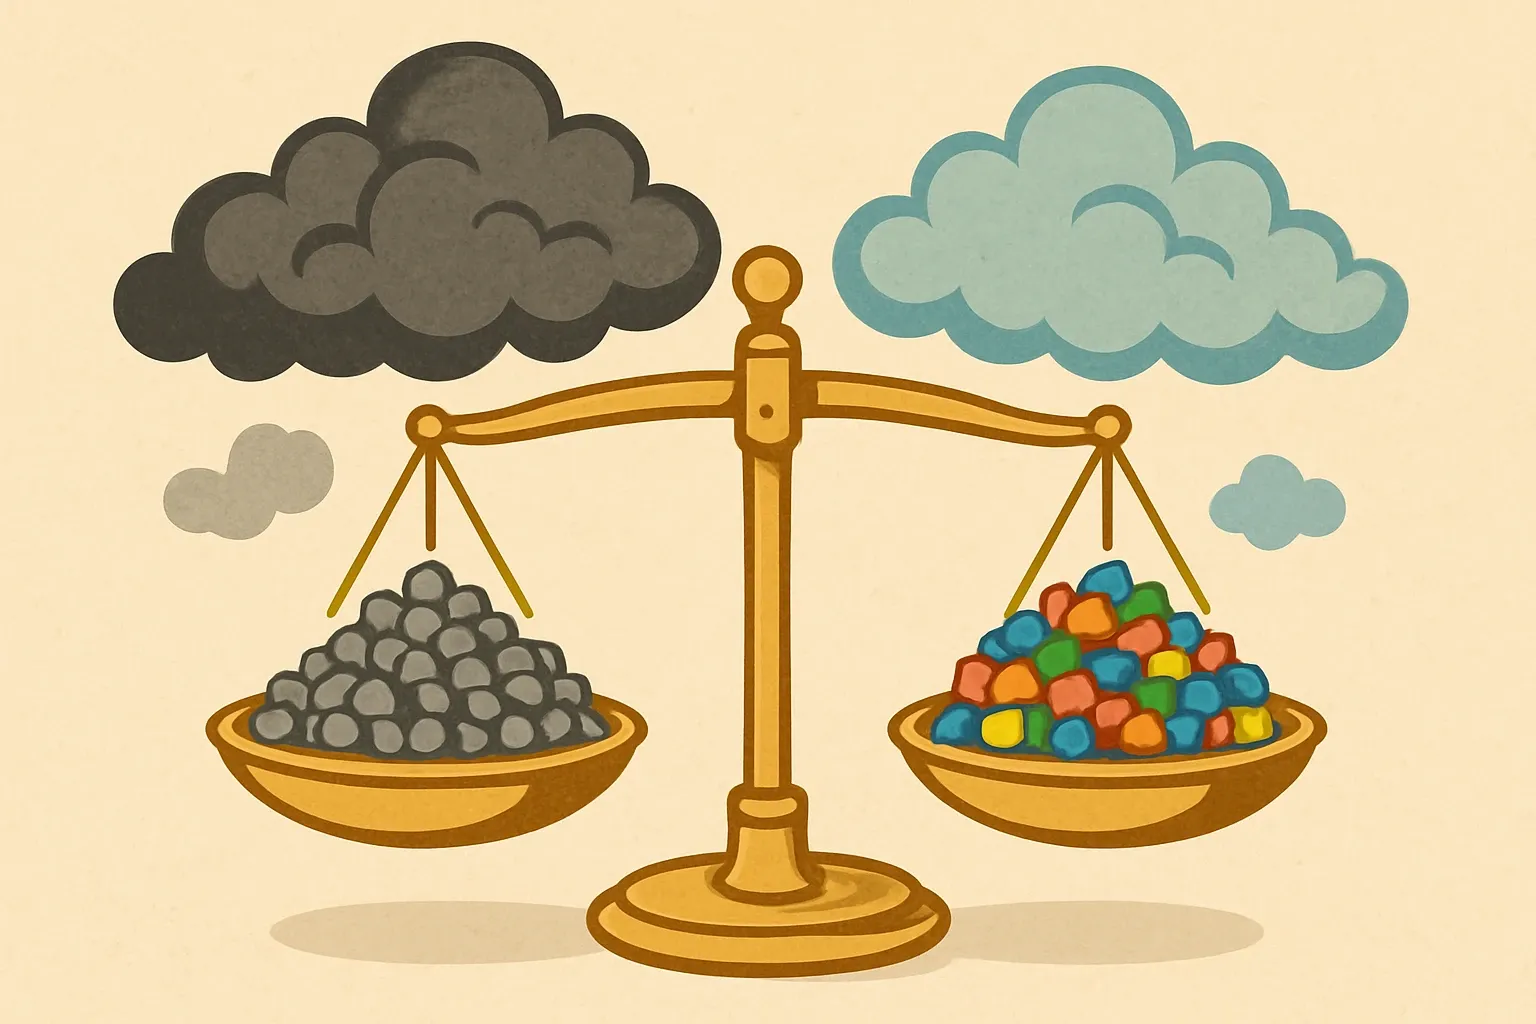
Why climate change is split now
EF 3.x and EN 15804+A2 align reporting with how carbon actually moves. Some emissions come from burning fossil fuels. Some relate to carbon in bio‑based materials. Some reflect land use change in supply chains. The split surfaces those pathways so reviewers can see drivers rather than one blended score.
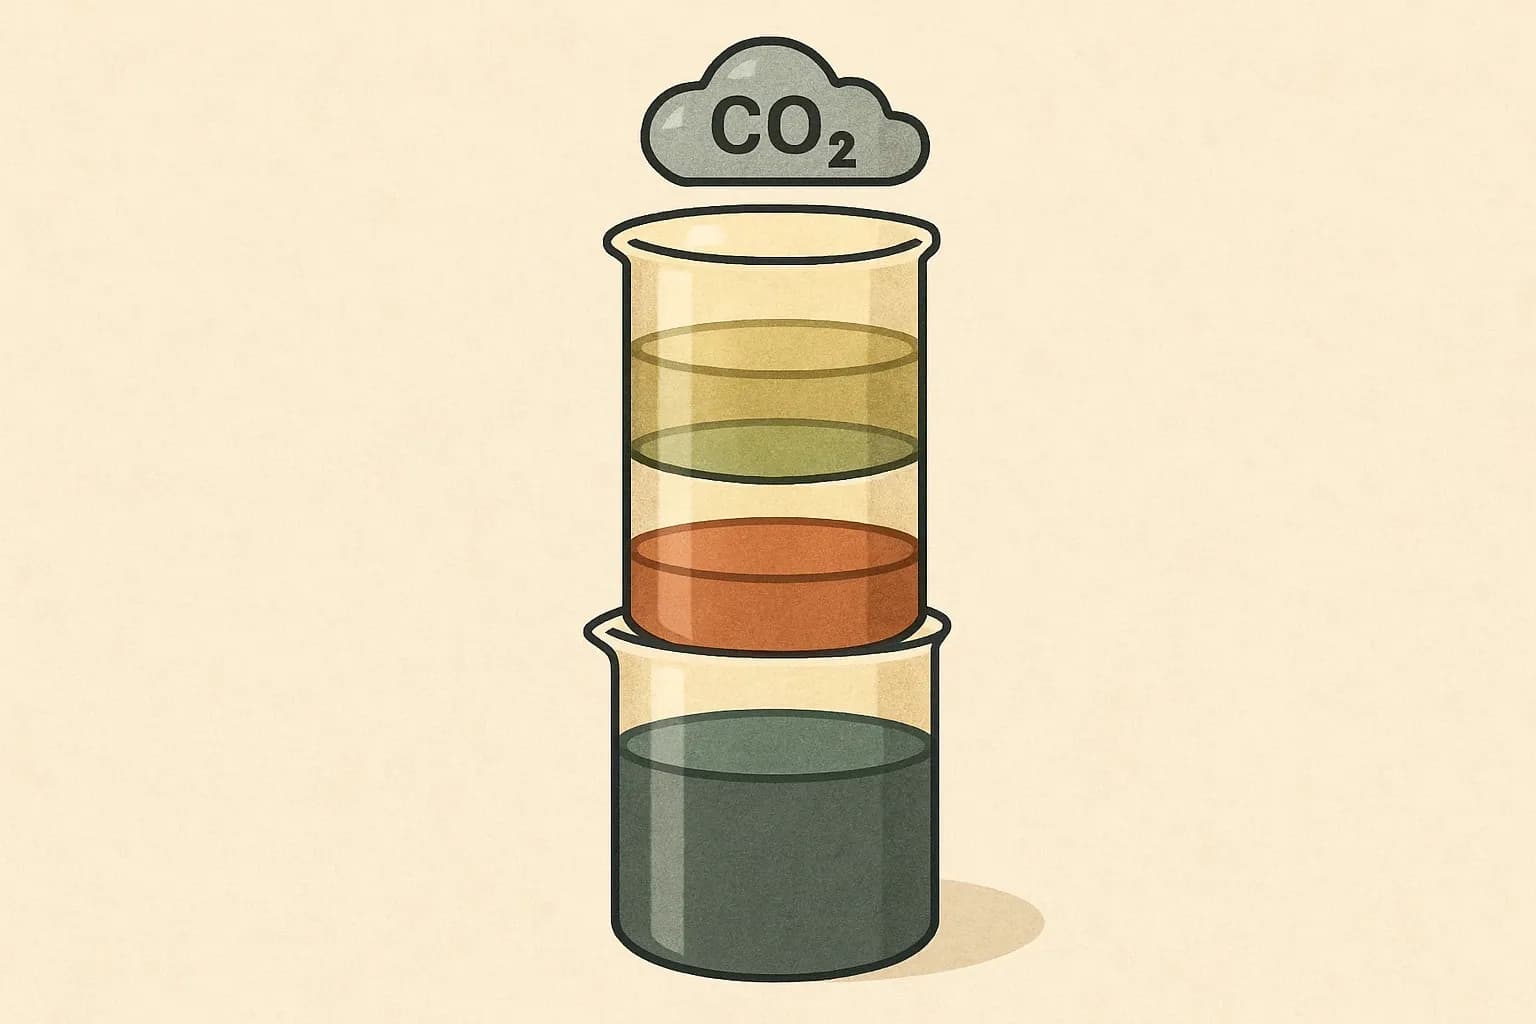
What each line means in plain English
Fossil GWP is the greenhouse effect from coal, oil, natural gas, and fossil‑derived feedstocks through the life cycle. Biogenic GWP tracks carbon flows tied to biomass, like wood starch and bio‑based polymers. Land use change GWP isolates emissions from changes in forests or soils linked to raw materials. Total GWP is the combined, decision‑grade number that buyers should compare across products.
Why biogenic values are sometimes positive
Biogenic does not mean automatic carbon removal. If a product has little or no biobased content, the small biogenic line you see is often upstream emissions bookkeeping, biogenic methane, or minor additives. That number can be positive in most stages, and that is normal. Negative values appear only with specific storage or end‑of‑life assumptions that keep biogenic carbon out of the air for a long time.
Metals and plastics behave differently than wood
Products dominated by steel, aluminum, or fossil‑based plastics usually show biogenic as small noise relative to fossil. Treat it as signal about trace inputs, not a headline. Wood, cork, or high bio‑content composites can show larger biogenic flows, and those deserve closer reading of storage and timing assumptions.
Want to make sense of EPD climate impact splits?
Follow us on LinkedIn for insights that help you navigate Total GWP in bids and improve your competitive edge.
The comparison rule that keeps bids clean
When evaluating design changes, suppliers, or a spec alternative, use Total GWP as the primary comparison. It is the figure that represents overall climate change across A1 to C4 and beyond if included. Use the fossil, biogenic, and land‑use rows as diagnostics to understand why Total moved, not as competing KPIs.
A fast diagnostic workflow that reviewers trust
Start with Total. If it drops, check fossil next to see whether energy, fuels, or petrochemical feedstocks changed. If Total looks similar but biogenic swings, you are probably seeing changes in wood content, paper packaging, or bio‑based binders. If land‑use change rises, review agricultural origins and sourcing geography. This sequence avoids chasing ghosts and speeds internal approvals.
Why some biogenic negatives are limited
Biogenic can go negative when the method credits carbon stored in the product or in certain landfill scenarios where long‑term storage is assumed. Many PCRs cap or define that credit tightly, and validators look hard at consistency across modules. Treat any large negative with caution and make sure the narrative explains the mechanism, otherwise gatekeepers will flag it.
Keep cross‑EPD comparisons fair
Compare like with like. Match declared unit, PCR, and life‑cycle scope before drawing conclusions. If two EPDs use different cut‑off rules or end‑of‑life scenarios, document the differences and, if needed, re‑express results to the same scope. That five minutes of discipline prevents weeks of rework later.
Reporting that sales and sustainability can share
Dashboards should chart Total GWP per product line for year‑over‑year progress, then include fossil, biogenic, and land‑use as small multiples underneath. It reads like a music equalizer. Everyone sees the headline first, then the knobs you can turn in process engineering or sourcing.
What to hand your LCA partner upfront
Provide energy data by fuel and process, a clear bill of materials with any bio‑based fractions noted, and end‑of‑life assumptions that match the target geography. Ask for a short memo that explains why each sub‑line moves between design options. That memo saves thier product managers from relitigating the same questions with every bid team.
The punchline buyers actually use
Use Total GWP for decisions. Use fossil, biogenic, and land‑use to explain the why. Keep assumptions aligned, write them down, and resist the urge to cherry‑pick a sub‑line because it looks nicer in a slide. That habit builds trust inside the company and with specifiers who read EPDs closely.