What “representative” really means
A representative year mirrors how the line normally runs. That includes typical energy mix, throughput, shifts, scrap, and maintenance patterns—expressed per unit of production so higher or lower volumes don’t skew the story. The key is that equipment, processes, and run-rate look much like they do today.
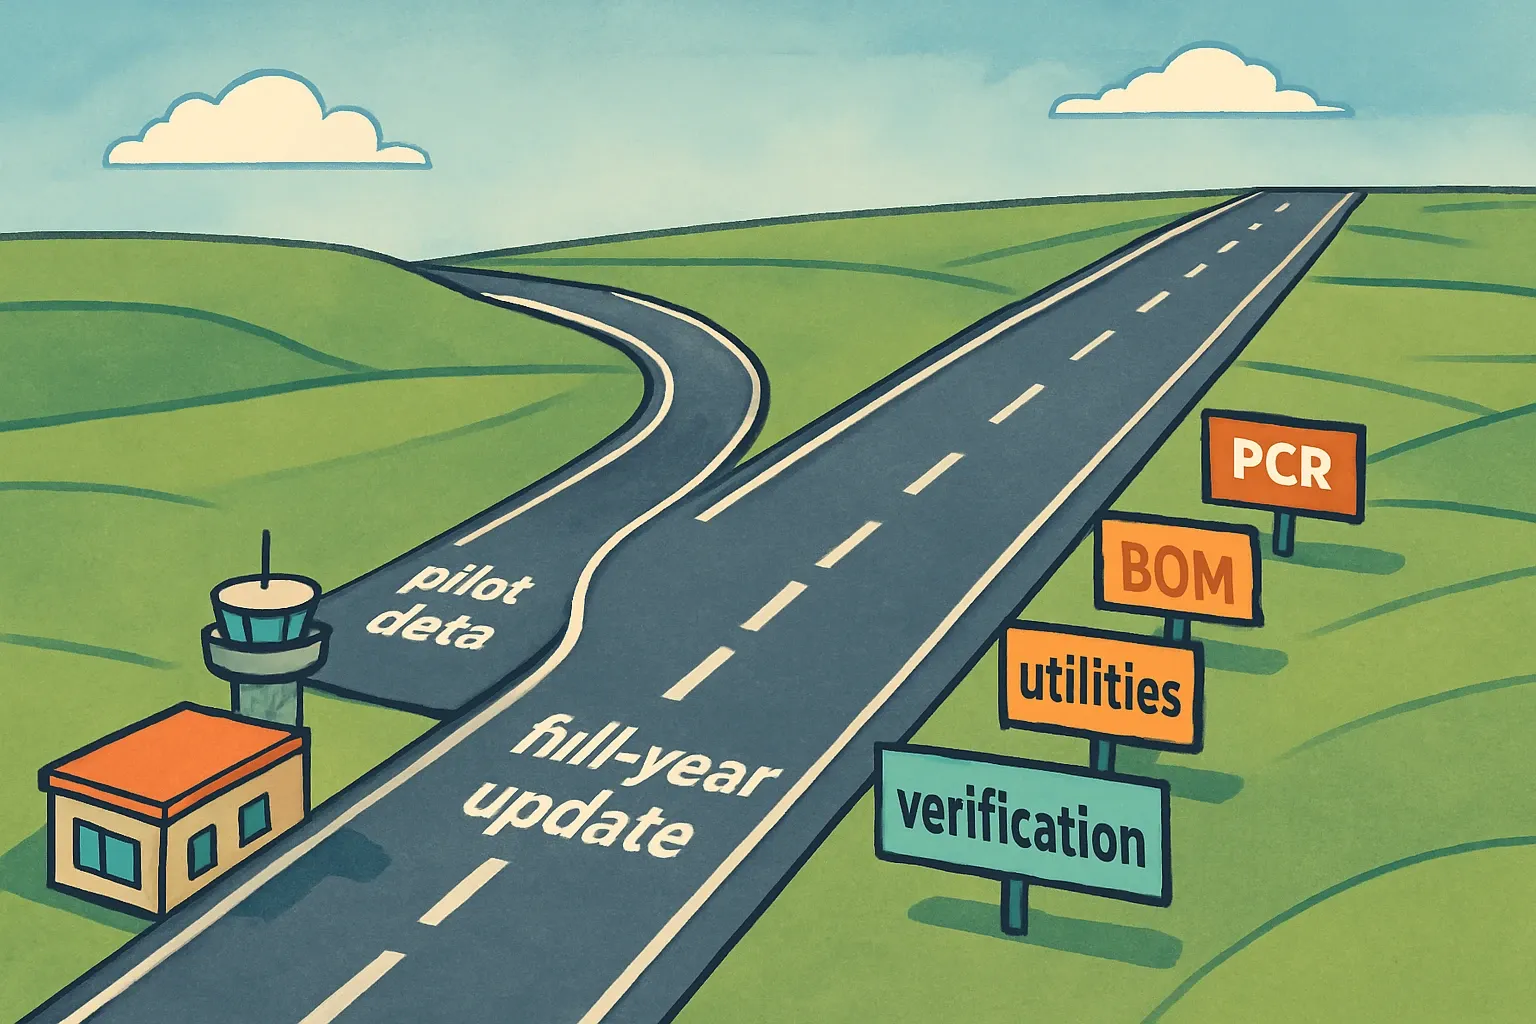
When a clean calendar or fiscal year wins
Most teams use the most recent full calendar year because utility bills and ERP exports line up neatly early in the new year. If the company tracks on a fiscal year, pulling the last closed fiscal twelve-month window can be faster. Either way, pick the span that is easiest to extract from existing systems and that reflects stable operations per unit produced.
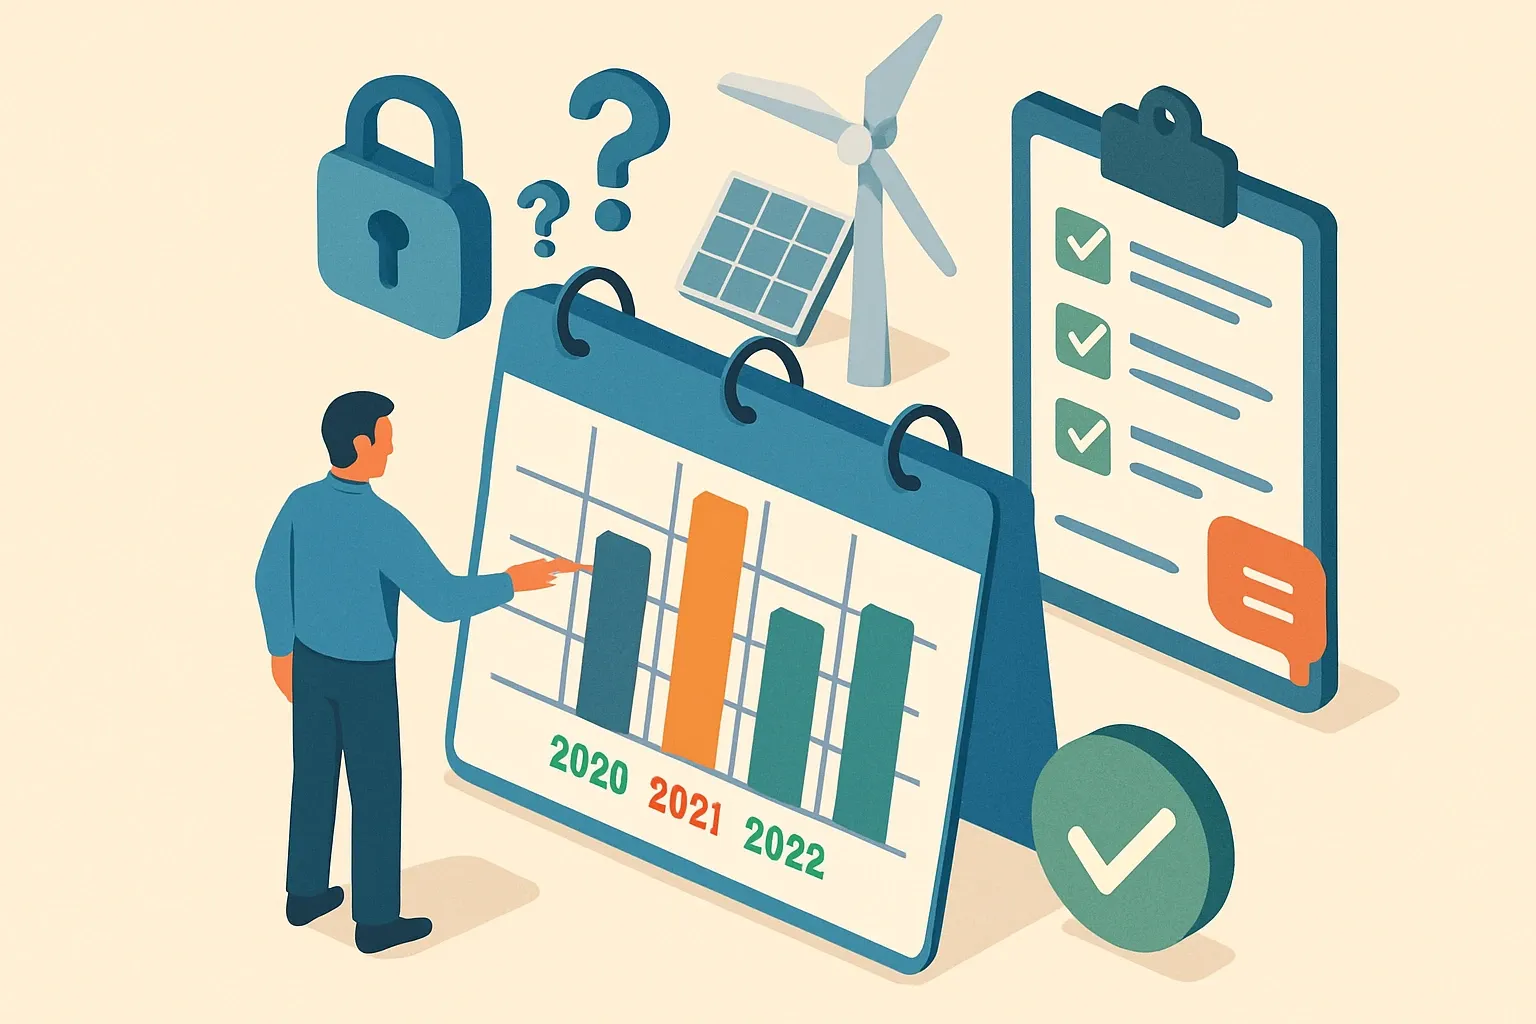
The 12-month rule of thumb, stated plainly
Program rules anchored to EN 15804 expect primary manufacturing data that represent a recent twelve-month period. If a product is too new for a full year, some programmes allow a design-phase declaration that uses at least one month of live production data and must be replaced after 18 months with a full-year dataset (EPD Hub GPI 1.3, 2025).
Avoid years that tell the wrong story
Skip periods dominated by commissioning, major outages, or unusual one-off orders that forced atypical runtimes. If there is no alternative, flag the anomaly and explain how you normalised or excluded it relative to the production volume.
New lines and ramp-ups
If production started mid-year, use a clearly defined window with stable operations and disclose the ramp. For prospective or design-phase declarations, set a calendar reminder to swap in a full twelve-month dataset before the temporary validity ends (EPD Hub GPI 1.3, 2025).
Match grid factors to your year
Electricity emissions factors change. EPA’s national average CO₂ rate for electricity use is about 0.394 kg per kWh based on eGRID 2022 data used in the 2024 calculator update, and regionally it varies widely (EPA eGRID, 2024). EPA released eGRID with 2023 data in January 2025, so pick factors that align with your reference period and region to avoid artificial swings at verification time (EPA eGRID Summary Data, 2025).
Document estimates like an engineer
If metering is imperfect, use engineering calculations and note assumptions, meters, and allocation steps. Two tight sentences in the background report can save two weeks of back-and-forth.
Why this choice matters commercially
Spec teams want confidence. A defensible data year means fewer verifier comments, faster publication, and fewer surprises when a project team cross-checks your numbers in a building model. That keeps your product in the choice set when schedules get tight. It is definitely worth the extra hour to choose well.
Bring it home without drama
Pick a recent full year—calendar or fiscal—that aligns with your data sources. Align grid factors to that window. Write down the few assumptions you actually used. When the next renewal rolls around, you will thank your past self.