Glass is a sustainability lever, not just a façade material
Glass unlocks daylighting and low‑e benefits that chip away at operational energy year after year. The industrial side still matters because manufacturing sits inside the 30 percent slice of U.S. greenhouse emissions, so cleaner glass has outsized impact on project totals (EPA, 2024).
The fork in the road: industry‑wide vs product‑specific
Industry‑wide EPDs are useful as on‑ramps. They set a baseline and educate buyers. In flat glass, the National Glass Association published a five‑year industry‑wide EPD in 2019 that expired on December 20, 2024, which means many teams now reach for product‑specific declarations by default (NGA, 2025).
Product‑specific EPDs tell your story with your fuel mix, your cullet rate, your plant data. They also showcase improvements as furnaces, batch, and logistics evolve. That transparency is what pushes you past a generic average when carbon targets tighten.
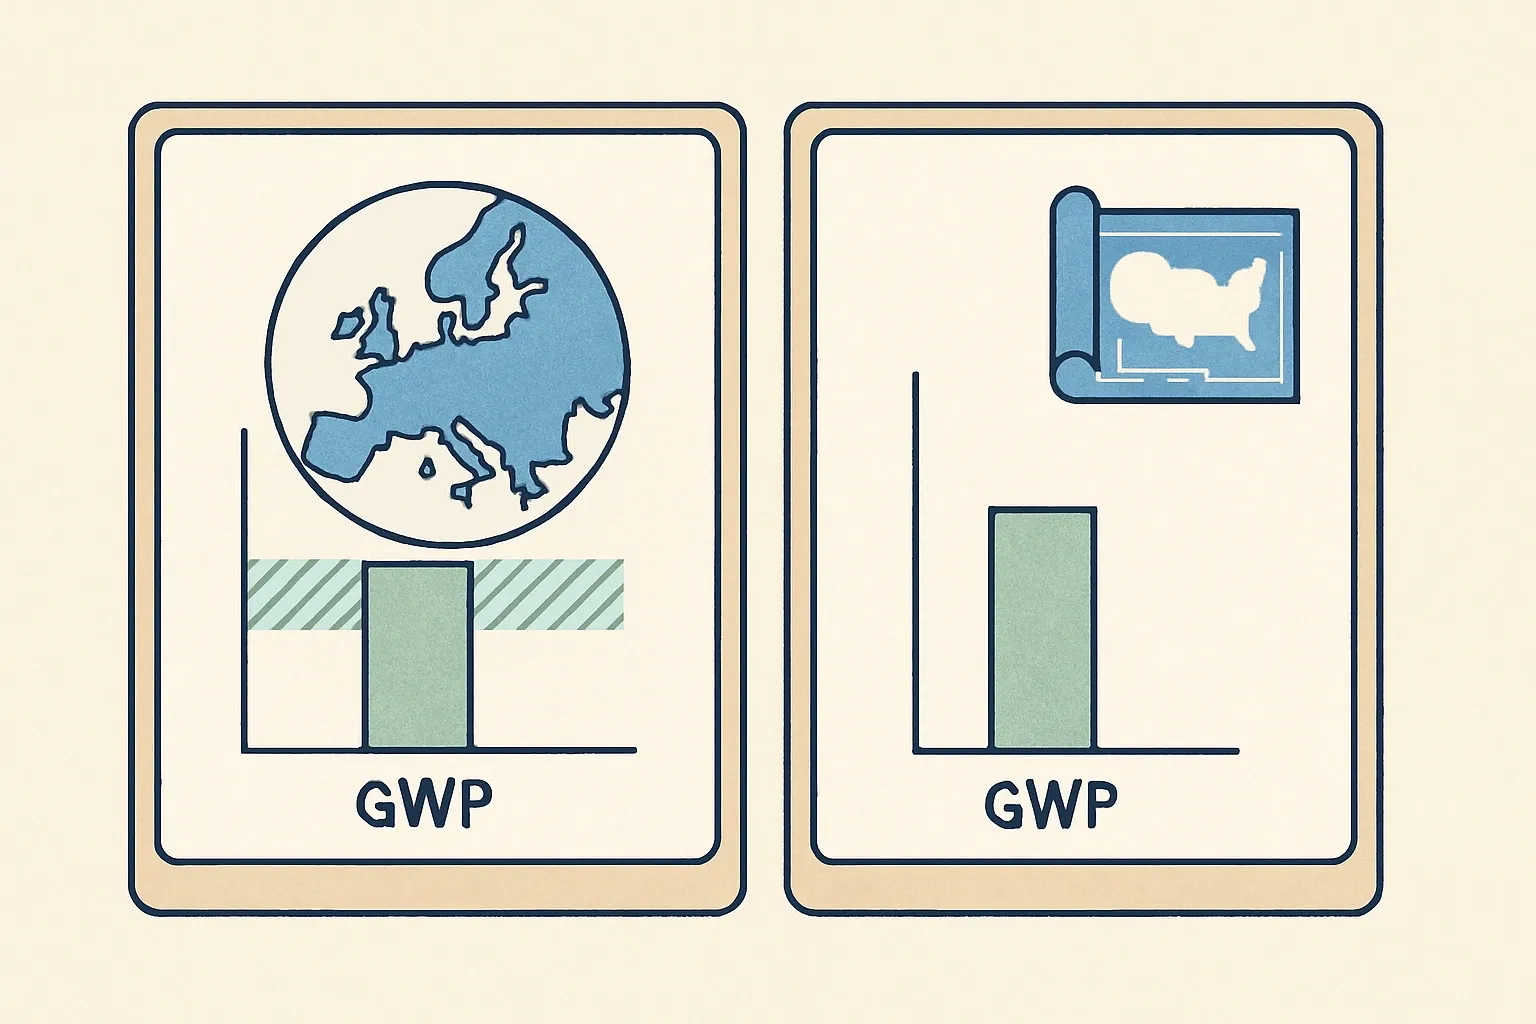
Numbers that move specs
Guardian’s renewed unprocessed flat glass EPD reports about 1,102 kg CO2e per metric ton for A1 to A3, which undercuts the 2019 NGA industry average of 1,430 kg CO2e per ton. That gap is the difference between being a safe pick and a borderline one on carbon‑screened bids (Guardian Glass, 2024, NGA, 2025).
Looking to gain a competitive edge with glass EPDs?
Follow us on LinkedIn for insights on how product-specific EPDs can help you win more specs and boost your ROI.
LEED tilts the table toward product‑specific
LEED v4.1 counts a product‑specific Type III EPD with external verification as 1.5 products toward the EPD credit. An industry‑wide EPD or a critically reviewed LCA counts as 1 product. That weighting shortens the path for project teams and quietly favors manufacturers with product‑specific coverage (USGBC Credit Library, 2024). LEED v5 is now active for many typologies and continues to center verified transparency, so the advantage remains clear (USGBC, 2025).
What buyers actually scan in a glass EPD
- The declared unit and scope, usually A1 to A3, so apples match apples.
- Verification details, including the program operator and critical review.
- Plant, fuel, and cullet signals that explain why your GWP is lower. If any of these are vague, teams default to conservative assumptions that can push you out of contention.
When an industry average helps, and when it hurts
If a category has thin data, an association average can get material approved faster. It can also hold you back if your real footprint is materially better than the sector signal. With the 2019 flat glass average now expired, a current product‑specific EPD is often the clearest path to being counted without debate (NGA, 2025).
Data confidence without the grind
A solid EPD flows from clean utility bills, batch recipes, cullet inputs, and transport distances for a defined reference year. The heavy lift is corralling that from plants, ERP and purchasing. Great partners take the data chase off your plate and keep reviews smooth so your engineers stay focussed on making better glass.
Your fastest route to a spec‑ready glass EPD
Start with the product lines that anchor revenue. Confirm the most common PCR in your competitive set. Pull the latest 12 months of production data, or use a prospective approach for new runs then refresh after a full year. Aim for product‑specific, Type III, externally verified. It reads as confidence, and it counts more in the only scoreboard that matters to bids.
The take‑home
Glass is already doing work on operational carbon. Product‑specific EPDs prove the manufacturing side is improving too, and they let you bank credit faster in LEED and in owner procurement screens. That is why they beat industry‑wide documents in most live spec battles. It is also why waiting for a new association average is seldom the winning play, definately not when your own data can show better performance today.